Tuesday, April 5, 2016

16 Ways to Optimize Your Product Landing Pages

If you’re in the e-commerce business and looking to increase your conversion rates, you’re in the right place. In this article you’ll learn 16 tips for optimizing your e-commerce product pages and the mindset you need to achieve explosive business growth.

optimizing product landing pages

Why Your Product Landing Pages Need Optimization

As an e-commerce store owner, you should constantly be optimizing your conversion rates and – most importantly – profits. From the landing page to the payment confirmation page, you have to optimize the flow of your visitors through each step. And one critical step is your product pages.

In this article I’ll focus on how to optimize your product landing pages’ usability and conversion rates by testing and following best practices for e-commerce pages. But remember, while conversion rate optimization best practices can guide you in improving your profits, there are no hard and fast rules.

When it comes to e-commerce conversion optimization every store is different, and what worked for somebody else might not work for you. The only way to be sure is to use A/B testing to statistically test if a best practice increases your conversion rates and sales too.

a/b testing product landing pages

So make sure to A/B test your new product page template against your old one. Never make changes to your e-commerce store without testing if they make you more or less money. That’s what I call the publish and pray technique, and it rarely helps your business grow.

Let’s get started!

1. Feature High-Quality, Dynamic Product Images of Every Product

Your product images can make or break your e-commerce conversion rates.

People like to see things before they buy them. But when you’re shopping online, you can’t hold or feel a product, all you can really do is look at it. So to make up for these shortcomings you need to work really hard on making sure your product images rock.

Use large, high-quality large images with multiple angle shots

The first key to image success is the size and quality of your images. In this case study Mall.cz tested larger images on their product pages:

product pages images

Control Design

high quality product images

Variation Design

They saw a 9.46% increase in sales when they used the larger product images. Try testing bigger product images on your category and single product pages.

Here is a checklist for other things to consider when creating your high-quality product images:

  • Clean and consistent background (white space or consistent background design, no clutter)
  • Consistent image lighting, contrast and saturation (make sure your images have the same look and feel)
  • Consistent padding around the edge of the image (minimum 30px)
  • Show the context of the product where appropriate (e.g. people wearing jewelry to understand scale and sizing)
  • Offer detailed, alternative views and 360-degree rotating images of your products where budget allows (or do this for your best-selling products)

2. Implement a product zoom feature

Since people can’t get a hold of a product when buying online, getting up close to it in the images to see details is essential.

Make sure visitors can zoom in on your products and see the finer details in HD.

zoomable product images

World Of Watches does a great job of this, offering contextual images of the watch on a wrist and high-quality zoomable images from alternative angles.

3. Increase trust and conversions with user submitted reviews

According to Marketing Land, 90% of customers say buying decisions are influenced by online reviews. And 88% of customers trust online reviews as much as personal recommendation (Search Engine Land). So it’s really important to test how adding reviews to your product pages affects your conversion rates.

reviews on product landing pages

If the reviews are in-line alongside your products, the visitor doesn’t even need to leave your page to go looking for reviews around the web.

In this case study Express Watches added customer reviews right into their product pages and saw an increase in conversion rate to sale of 58.29%.

Test adding on-page reviews (impartially submitted by users) to your single product pages and see if your conversion rates improve.

4. Use wish lists to drive traffic and increase sales

According to BigCommerce incorporating wishlists or “want” buttons helps customers remember a product they liked but couldn’t buy straight away.

want buttons on landing pages

Shopify offers an app for the Want button – these post to people’s Facebook timelines too and drive more social traffic to your store. The traffic is also primed for conversions as people love to buy what their friends recommend.

A/B test adding wishlists and want buttons to your store to drive referral sales and traffic.

5. Don’t hide out of stock products

In this case study by Marketing Sherpa, they leveraged a mixture of transactional emails and segmented email lists to increase sales and conversions.

The first step was to show out of stock products with the option to get notified when they were back in stock.

out of stock product optimization

This added the lead to a per-product lead email list. When the products were back in stock the lead email list got sent a transactional “back in stock” email, inviting them to return to the store and checkout.

In this case study these emails converted at 22.45%!

6. Increase trust by adding a privacy policy link

Visitors need to trust your brand before committing to signing up or shopping with you. So adding trust factors such as privacy policy links to forms can really help boost your conversions.

Let’s take the previous example of signing up to get notified when products are back in stock. You could further increase conversion rates by testing adding a privacy policy link to the form.

In this case study BettingExpert did just that, and saw a 19.47% increase in their form conversions.

privacy policy on landing page

Test adding privacy policy links to your get notified forms or lead generation forms on your product pages to increase conversions.

7. Link to product sizing charts on page or in a pop-up

When it comes to products like jewelry, sizing can make or break a conversion. So it’s worth testing if placing sizing information alongside the product affects your conversion rates.

sizing info for product pages

You can place a link to a sizing page as seen on the product page above, or have the sizing chart pop up as seen below:

product pages with sizing information

Always anticipate the questions your prospects will have and make those answers available to them. Test adding sizing information to your product pages to improve conversion rates.

8. Personalize your related product recommendations

You all know recommending related products is a great way to increase your average basket value and conversion rates. But to take your selling to the next level, you can add personalization to your recommendations.

According to a case study by Smart Insights: “Compared to average site conversion rate, conversion rates were increased by 332% on Millets.co.uk and 277% Blacks.co.uk where a visitor selected a personalized product recommendation.”

They looked at two types of personalization, “What customers ultimately buy recommendation” and “Rule-based cross-sell personalized recommendation.”

For example, when checking out hiking equipment, visitors were shown these personalized rule based recommendations below:

product recommendations on landing pages

A/B test using personalized product recommendations to increase your average basket value and conversion rates.

9. Use live chat transcripts to find product information gaps

So you all know the benefits of using live chat on your e-commerce websites; as long as you’re tracking those chat conversions, it’s convenient for the customer and cheaper than phone-based customer service teams.

But the real value of live chat, in my experience in testing with Olark, is in the transcripts.

With Olark you can review and even export your live chat transcripts for analysis – this is a powerful conversion tool!

live chat on product landing pages

For example, we used live chat in this e-commerce CRO case study and found there were information gaps on the e-commerce store’s product pages: things about the products the visitors wanted to know but couldn’t find answers to.

When we analyzed the transcripts from customer conversations we learned these insights:

Customer: “Hey guys, Could you please tell me if your sterling silver jewellery will tarnish if worn in salt water? Thanks”

Customer: “I was looking at the Gold ‘You are blessed’ tan bracelet and was wondering if it’s durable enough to wear everyday?”

From this we were able to create a hypothesis to A/B test: More detailed product info (perhaps behind a tabbed system for people looking for in-depth information) will mean less reservations around the purchase and more checkouts.

Analyze your live chat transcripts for product information gaps and add the missing information in-line alongside your products on the landing pages.

10. Leverage visual hierarchy to improve your product page conversions

Visual hierarchy is about guiding your visitors step by step through the different elements in your page design. The path they take and the order in which they experience your design and copy can be the difference between a bounced visitors and a checkout.

In this case study Underwater Audio improved the visual hierarchy of their landing page by changing the order of the different elements of their value proposition: the headline, features and benefits section, image and call to action.

By changing the visual hierarchy they increased sales by 35.6%.

product landing page design

Test changing the order in which visitors read the different elements of your product landing pages. For example, don’t ask them to add the product to their cart before teaching them enough about the product and its features. You can ask for the sale too early and lose it.

11. Get the length of your product page copy just right

In this guide David Crowther suggests long copy works best when your product is:

  • Expensive
  • Complex with many features
  • Part of a specialized sector
  • Not unique
  • Unsought

He also says short copy works best when your product matches these points:

  • Your product or offer is very simple and requires little explaining
  • Your price is inexpensive
  • Your call-to-action costs no money: taking a free trial, signing up for a newsletter, etc.

Make sure to test your product copy length and be more explicit and detailed for complex and expensive products.

12. Use product videos to increase conversion rates

You hear a lot in the conversion world that video sells. But the truth is, as with any conversion best practice, it depends.

For example in this case study a fitness business spoke with their customers to learn what was missing from their product pages. The main question or concern visitors had was, “How will these products look on me in a fitness class?”

This prompted the business to create better product images and videos that address this question.

product videos on landing pages

They only made a small number of videos first as a cheap test. The results showed that for search traffic, revenue per visit increased between 25% and 100%, depending on which consumer segment they were analyzing.

Test adding videos to your product landing pages (if the your data suggests you need them) and only invest in one or two videos at first to test their impact on profits. If it works as well as it did for this business, it’ll be worth rolling out more videos for your landing pages.

13. Communicate shipping on all pages clearly

It seems like a no-brainer, but so many stores I see don’t show shipping costs until much too late in the buying process. It’s important to communicate shipping costs on every page (especially your product page) and where possible to offer free shipping.

shipping on product pages

Nearly half of all online orders come with free shipping, so you should at least test if you can build shipping costs into your product pricing and see if it creates more profit.

A study by E-tailing found that 44% of people abandoned a purchase process because the shipping costs were too high.

shipping info for product landing pages

What about if you must charge for shipping in your business model?

If your product doesn’t allow for free shipping then make sure to use a flat rate fee and show it on every page. You could place it in the header and footer of your store’s web page designs.

In this study 47% of people showed they would abandon a purchase if they got to buy page and learned shipping was extra. Show shipping costs upfront!

14. Show the expected delivery date on the product landing page and cart page

In the age of 30-minute drone deliveries, customer don’t expect to wait long for their products.

An infographic from Milo demonstrated that visitors are much more likely to abandon the sales funnel if they have to wait days on end for delivery times.

product landing page best practices

When asked what would encourage them to complete their purchase, 60% of respondents said a guaranteed delivery date.

Test adding expected delivery dates to your product pages or offering guaranteed delivery dates and displaying them in-line alongside your product.

15. Show an “added to cart” notification

When someone tries to add a product to their cart, you want to let them know they have been successful.

Basically, you need to constantly be giving the user feedback. This is seen as an interaction design best practice.

Essentially, feedback answers questions across four categories:

  1. Location: Where am I? (persistent navigation)
  2. Current Status: What’s happening – and is it still happening? (breadcrumbs, interface state)
  3. Future Status: What will happen next? (call to action)
  4. Outcomes & Results: What just happened? (alerts, e.g. “item added to cart” pop-up)

added to cart notification

Here you can see when you add a product to your cart on this site, you get a pop-up notification and a call to action to continue to the cart: these represent an outcome/result and future state prompt.

Test adding more interaction design best practices to your product landing pages so your customers always understand what’s going on.

16. Leverage user testing to inform and test your product page designs

Appliances Online created 125 user testing videos (giving them about 250 hours of footage) to find problems with their product pages. From these videos they found amazing insights they could then turn into hypotheses and A/B tests.

For example, many users said the pages were too busy; others said the service information needed to be more explicit and the video experience could be improved.

These improvements resulted in a 9.5% increase in sales, and 37% more visitors viewed the product videos. Visitors who viewed the videos were 57% more likely to add items to their basket, too.

Make sure use user testing to inform your testing ideas. Constant iteration and improvement is one key element to getting killer conversion rates.

Remember: Don’t blindly copy your competitors

don't copy competitors

You must remember that just because a “best practice” or a certain test increased someone else’s revenue, it won’t necessarily do the same for you.

A/B testing is a great way to improve your product landing pages and increase your conversion rates and profits, and it’s the best way to know that a change to your site or your landing page is really going to work for you.

So don’t blindly copy your competitors – they’re probably doing the same.

About the author

Giles Thomas is an e-commerce conversions expert. He’s the CEO of Whole Design Studios & founder of AcquireConvert. He is a head marketing mentor for Google and a member of the prestigious Google Experts Program. Join his free, 5-day ecommerce optimization course here.

Find out how you’re REALLY doing in AdWords!

Watch the video below on our Free AdWords Grader:

//fast.wistia.net/embed/iframe/hb98wcj863?videoFoam=true&plugin%5BdimTheLights%5D%5Bsrc%5D=%2F%2Ffast.wistia.com%2Flabs%2Fdim-the-lights%2Fplugin.js&plugin%5BdimTheLights%5D%5BoutsideIframe%5D=true

Visit the AdWords Grader.

from Internet Marketing Blog by WordStream http://ift.tt/1USPLMq


from WordPress http://ift.tt/1V6Jn3C

How to fix discrepancies in your web analytics data

Google Analytics, like every web analytics tool, does not deliver accurate data.

There are many reasons behind this including:

  • Visitors don’t allow JavaScript
  • Visitors block cookies
  • Pages missing code
  • Location of the code on the page

There are certain actions though that can be exactly measured, as they are recorded in back end systems.

We know exactly how many transactions are placed, leads are generated, contact forms submitted, etc. For these actions, we can audit the accuracy of the web analytics and identify errors in the tracking.

This is critically important as these actions are nearly always macro conversions and, if they are not tracking correctly, we cannot evaluate the performance of marketing campaigns or the impact of website features.

The problem

These actions can never be recorded 100% accurately in any web analytics tool (you should not try and report your revenue to the tax office using web analytics data) but they should only be 2%-3% off reality.

If the difference is more than 5% (with a large enough sample size), you have an issue somewhere in your tracking. The code works, or no data would be collected at all, but it is not correctly submitting measurements to the web analytics tool in all cases.

Causes

To simplify the language within this blog post, I will be using transactions on an Magento ecommerce website compared to Google Analytics data as an example for the remainder of the post.

The first step is to check if there is a discrepancy.

Extract daily orders for 8 to 12 weeks for both Magento and Google Analytics and then compare performance at a daily level. As long as order volumes are high enough, the discrepancy should be fairly consistent for each day.

Transaction data comparison

Ideally Magento should report transactions slightly higher than Google Analytics but no more than 5%. If the difference is more than that, you have an issue.

The key reasons for a difference in transactions recorded within Google Analytics (or any analytics tool) and Magento are:

  1. Orders placed over the phone/offline are recorded in Magento but are not captured in Google Analytics
  2. Orders placed on computers using internal IP addresses are recorded in Magento but not in the Google Analytics View (as exclusion filters applied)
  3. There is a certain device/browser/browser version where the Google Analytics transaction tag does not fire
  4. There is a payment method where the visitor doesn’t return to the Order Confirmation page, therefore never triggering the Google Analytics transaction tag
  5. There are certain variable values that break the code e.g. a product name that contains “ or ;
  6. The amount of the information included within the tag is too long (e.g. lots of product information is captured, exceeding the limit of 8,192 bytes
  7. The visitor leaves the Order Confirmation page before the Google Analytics transaction tag can be fired

Identifying the cause

The challenge is to identify which one (or more) of these apply to your business. The first two reasons can be identified through an internal investigation into what data is being recorded in each of Magento and Google Analytics.

For the second, check into what filters are applied and/or create a new Google Analytics View with no filters applied to see if that changes the data.

The third reason requires some analysis within Google Analytics.

Check the conversion rate for each device and browser version. If it is 0% for a certain option (with a decent number of sessions), you may have identified the culprit/s. Check more into the data or even check through making a transaction on that device/browser to confirm the transaction code isn’t fired correctly.

For reasons four to six, extract a list of the transactions from Magento and Google Analytics for three non-sequential days during the previous period (make sure these days contain the typical discrepancy) including the transaction ID. Compare the two lists using the transaction IDs and identify the transactions which are not recorded within Google Analytics.

Review these transactions for patterns of payment methods, particular products or just very large transactions. The challenge is that some missing transactions were just not recorded while others should fit the pattern of one or more of the above reasons.

For the final reason, check the location of your Google Analytics code on the page. If it is lower in the page than immediately below the <body> tag, that could be the cause.

Solutions

Once the cause of the discrepancy has been identified, it should naturally suggest the solution. These solutions include:

  • Ensuring you are comparing apples with apples e.g. transactions placed by external visitor on the website
  • Adjusting the process for a payment method so that the visitor is returned to the Order Confirmation page
  • Fixing the transaction code so that it works for all browsers and devices
  • Removing or escaping all special characters within product variable names
  • Ensuring that tags don’t exceed the 8,192 byte limit
  • Changing the location on the Transaction code on the Order Confirmation page

Once you apply these fixes, the discrepancy should immediately reduce. Continue checking and making improvements until the discrepancy between your back end numbers and your web analytics numbers reduces to under 5%.

One final note, web analytics data can also be higher than that recorded in back end systems. This would be the case if duplications are recorded in GA but automatically excluded in back end systems (e.g. for transactions) or if data has been cancelled out of the backend systems e.g. cancelled orders, fake leads.

from Search Engine Watch http://ift.tt/1V6siHb


from WordPress http://ift.tt/1RZhcDJ

The 2016 State of Link Building Survey – Results & Analysis

Posted by Nicholas-Chimonas

[Estimated read time: 18 minutes]

SEO futurists have predicted the death of links as a ranking signal for years on end. That hasn’t happened yet, and I’m happy to say that link building as a practice has greatly evolved.

But rapid change often creates confusion, and there doesn’t yet seem to be a strong consensus on how link building teams should be constructed, where they fit in the marketing plan, and how much ought to be invested into link acquisition.

To bring more clarity and transparency to a complicated pillar of SEO, I’m proud to present to you the 2016 State of Link Building Survey results!

Let’s be frank: link building has had a volatile history filled with spam, tricks, and get-rich-quick schemes. When Google introduced the first version of Penguin in April of 2012, the practice of link building received a severe shock to the system.

link building content marketing april 2012.png

“Google Trends analyzes a percentage of Google web searches to figure out how many searches were done over a certain period of time.” – Trends Help

In the minds of many, content marketing has been the modern replacement to link building. To me, this is a flawed perspective, as content marketing has many goals beyond links; link acquisition is a highly ancillary product amidst the primary goals of content marketing. Links also serve a different set of goals than content marketing.

The process was supposed to look something like this, from Rand’s Search Love deck.

rand searchlove link building slide.png

The manual promotion, the deliberate intention of earning all of the links you deserve via manual outreach, is what seems to have been missing in many marketing strategies of late.

If you’re interested in learning about how we promoted this survey, check out the methodology section below. Otherwise, hit the jump link to get straight to the questions and results. You can access this year’s raw data sheet here. I encourage you to create your own graphs/analysis with Google Sheets (Insert > Chart…) and share them in the comments! First make sure to create a copy (File > Make a copy…).

Take me straight to the survey results!

Methodology

I have immensely enjoyed the fascinating data presented in the 2013 and 2014 annual link building surveys. 2015 passed without a survey, and I felt compelled to gather updated data from the industry at large. It’s interesting to note we had 435 responses to this year’s survey, as compared to 315 total in 2014.

It’s also important to mention that this survey doesn’t contain the exact same questions presented in 2014’s survey. Link building has been a constantly evolving landscape, and our survey has attempted to evolve with it.

Check out Moz’s link building category page and skim through the posts of 2015 and 2016. There are some very smart, very legitimate evergreen digital marketing strategies in there, as opposed to “the next big trick” or which tactic is on the chopping block for overuse.

As such, the questions in this year’s survey were designed to reflect link building’s evolution into a more legitimate and integrated marketing channel.

I’m not the David Bowie of the SEO world, so I knew I’d need help promoting the survey to gather an acceptable sample size. To that end I reached out to the founder of Credo, John Doherty. He’s a fellow who has bestowed plenty of wisdom upon me with his digital writings, and has conducted similar research on the average cost of SEO consultation recently. He agreed to co-author this post with me, and aid in promotion.

Beyond emailing our own newsletter subscribers of Credo and P1P, we spoke with a few people in an attempt to increase our reach with the survey. To each one of these individuals we want to express our sincere gratitude. Thank you!

Without any further ado, let’s jump into the data.

Who took the survey?

As expected, a majority of survey respondents were agencies. Link building is still typically an agency offering, despite predictions of link building moving in-house or to PR teams. In our 2016 survey, the percentage of Agency respondents versus In-House has actually increased.

41% responded as Agency in 2016 compared to 37% in 2014.

27% of respondents in 2016 selected In-House SEO compared to 30% in 2014 that responded as “SEO Manager or head of SEO”.

However, this year we segmented our In-House answer selections to include “In-House Content Marketer” and “In-House PR.” In 2014, the only option potentially relevant to In-House professionals was SEO Manager, so it isn’t quite a direct comparison. That said, we had more available answer selections for In-House than before, and Agency still won out.

It’s interesting that In-House PR received so few responses. There have been many blog posts proclaiming the need for migration of link building responsibilities to PR departments, but in my experience that hasn’t been reflected in reality.

In an overwhelming majority of link building campaigns I’ve been involved in, link acquisition is simply not at the forefront of the minds of PR agencies. While successful PR does create some of the highest-quality link opportunities, most of them are left on the table; they still require manual outreach to convert to links.

It’s possible our promotional efforts are the reason we didn’t reach many in the in-house PR role. However, in my experience collaborating with in-house PRs, it is very rare to encounter someone who focuses on building links.

What size of companies are actively involved with link building?

size of clients or companies worked for.png

This was a “Select as many as apply” answer set, but with a majority of respondents selecting 1–200 employees, link building appears to still reign supreme in the SMB market (although it’s worth noting that 10% of respondents were from large businesses). The common line of thought is that enterprise businesses naturally earn so many links that active link acquisition isn’t as necessary.

To dive a bit deeper, I further segmented the data by respondent type with Google sheets’ Charts function. It isn’t surprising to see agencies and in-house professionals working with a higher number of larger enterprises compared to consultants, freelancers, and business owners. Still, across every respondent type, SMBs were the most popular selection.

http://ift.tt/1RZ0ZOK

How many people are on your link acquisition team?

how many people on your team.PNG

81% of respondents reported they work alone or in link building teams of 1–5 members. It’s possible those building the links are typically wearing many hats, with link building packaged into a larger service or part of many other in-house responsibilities.

I’ve worked with a few larger businesses’ in-house teams of full-time link builders, but it’s a rarity. The largest in-house link building team I’ve worked with had 20 employees on staff. Clearly this is by no means commonplace. Most businesses either don’t need or don’t believe they need full-time link builders. It’s mostly SEOs — who are typically members of small teams already — that either do the work, or recognize its value and outsource to agencies with small, dedicated teams.

I also broke this out into agencies versus in-house. Although agencies did submit more responses with larger team selections, the spread is quite similar.

http://ift.tt/1RZ0ZOM

As you can see, there are far fewer lone wolves in an agency setting. In-House folks responded with nearly double the selections of “Just me!” compared to Agencies. In every other team size category, Agencies responded more than In-House. Keep in mind these are fairly similar sample sizes, with 180 respondents identifying as Agency and 163 as In-House.

What is the average client’s or business’s budget allocated to link building per month?

On this question, we requested in-house folks calculate the total of all link building employee’s monthly salary. Being a part of a larger package or add-on duties to an in-house team could affect this spread, with over a third of respondents selecting under $1,000.

In 2016, our audience reported much lower costs for link building compared to the 2014 survey. This could be due to a different audience reached, or less focus on link building itself.

The $10K–$50K option was too large of a range in 2014, and with 0% selecting $50K+, we lowered and segmented our ranges further in 2016. This is 2014’s distribution of the same question:

2014 cost of LB graph.PNG

This year’s data becomes more interesting as you break it up by our audience’s professions. Two distinct groupings within our respondent types were exposed. Agency and In-House are similar in cost spread, with In-House having slightly more on the higher end. The other similar grouping was Consultant/Freelancer and Business Owner.

http://ift.tt/1N5WcU4

http://ift.tt/1RZ130O

http://ift.tt/1N5WcU6

http://ift.tt/1RZ1056

What model do you use to charge for link building services?

survey q5 model used to charge for LB.png

This spread is somewhat deceiving, as there was essentially only one answer for In-House respondents to select. 154 respondents selected the top voted answer, which would make sense with 163 identifying as In-House. Remember though, this isn’t indicative of reaching more of an In-House crowd as opposed to agencies (180 responded as Agency).

This question was structured this way specifically because there are so many different ways that Agencies and Consultants/Freelancers sell link building in 2016.

Still, this question confirmed a suspicion raised by the earlier question regarding team size. Packaging link building as part of a larger service is indeed the top-selected option for all other respondent types besides In-House, and that probably affects the necessary team size of dedicated link builders.

The responses typed in when “Other” was selected are quite interesting. A couple of “other” responses actually fit in other buckets that were options, so they aren’t included. I’ve also segmented the selections by respondent type in the pie charts below.

Agency:

http://ift.tt/1RZ130Q

“Other” entries by agency respondents:

“We sell digital PR retainers that earn media — we don’t sell links.”

“It’s wrapped into our monthly retainer.”

“We’re a public university running on an agency model; this is included in budgets.”

Business Owners, Consultants, Freelancers:

http://ift.tt/1N5WcUa

“Other” entries by Business Owners, Consultants, and Freelancers:
“Link building is just a small part of the ‘packages’ we sell clients on.”

Author note: A comment like this indicates that some survey respondents identifying as “Business Owner” may actually be agency owners, rather than business owners that handle link building on their own. It’s possible the Business Owner data is somewhat skewed by owners of agencies. Only 9% of survey respondents identified as Business Owner, so the data should not be too far off.

“Charge a flat fee for contacting a set number of websites.”

“I do it for myself.”

“Fixed plus performance-based rate.”

“I don’t link build, I consult on how to do it the Google-compliant way.”

In-House:

http://ift.tt/1RZ130S

“We don’t build links at all. We create and publicize great content and the best natural links come themselves as natural by-products.”

“Everyone in the SEO/Content Team does link building as part of their jobs.”

“We have a PR person do our ‘link building.’”

What percentage of the overall SEO budget is dedicated to link building?

survey q6 what percentage of budget towards LB.png

What percentage of your SEO work/campaigns is focused on link acquisition?

survey q7 what percentage of work dedicated to lb.png

These two questions were designed to be complementary and are most interesting assessed together, rather than separately. One might assume that the % cost of link building will be equal to the % time of a campaign spent on it, but that was clearly not the case.

http://ift.tt/1N5WcUe

This data seems to suggest that as an industry we aren’t charging enough for our link building services. Significantly more votes were towards a lesser percentage of budget, while spending a higher percentage of time on the service! Although 230 responses fell in the 0–25% of budget range, only 156 responses were in the 0–25% range of time spent.

An alternate explanation is that people don’t put “budget” towards link building in a traditional way, but do spend significant time on it. Link building isn’t a service that is necessarily expensive in a monetary sense. Low overhead, relatively inexpensive tools, and as a later question in this survey illuminates, frequently cheap labor.

2016 is only the second year the link building survey has asked this question, and there are significant differences in our dataset compared to 2014.

53c3ea1e705420.94374006.jpg

2014 Link Building Survey responses to “What percentage of your overall SEO budget is allocated toward building links?”

In 2016, the 0–25% budget range increased from 27% to 53%. There was no change for the 26–50% budget range, remaining at 27%.

The 51–75% budget range has fallen in this year’s survey from 40% to 16%.

Here are a few possible explanations I could think of; let me know your own ideas in the comments!

  1. We may have reached a different audience than the 2014 survey. With the evenness of sample sizes between agencies and in-house, we received lesser responses of dedicated budget towards link building.
  2. We had 120 more respondents, comparing 315 in 2014 to 435 in 2016. Perhaps this contributed towards a more even spread.
  3. People are putting less dedicated budget towards link building. In the past two years, link building has become more integrated into other departments and marketing processes, packaged in as part of a holistic service, and less specialized link builders exist overall.
  4. A mix of all of the above.

What is the average salary of a link builder?

survey q8 avg salary of LBs.png

This was another question where we asked non-agency respondents to deliver a unique answer. If they were the only one responsible for link building, we requested they enter their personal salary. If multiple employees work on link building in-house, we asked for respondents to average their salaries together for a single response. All answers are in USD.

Sadly, I can’t say I’m surprised to see $20,000–$29,999 reign supreme. Here are the breakdowns by respondent type.

http://ift.tt/1RZ130U

http://ift.tt/1N5WfPQ

In-House clearly has a much more even distribution than agencies. This is probably influenced by agencies that outsource work, which makes me wish I had included a response option for “Do you outsource work?” Alas, hindsight is 20/20. I have a hunch this did affect agency salary ranges.

Another possible contributing factor to the more even spread of In-House into higher salary ranges is the types of businesses that hire in-house SEOs, content marketers, and PRs. From what I’ve observed, most in-house jobs are with larger enterprises that are located in bigger cities. The cost of living is higher, and so are the wages. Agencies, on the other hand, are in all ranges of city size, some with a lower cost of living.

http://ift.tt/1RZ105h

http://ift.tt/1N5WfPS

I didn’t originally plan to include Consultant/Freelancer or Business Owner segments in this section of analysis, but it’s an interesting side note that the distributions were within 1–2% of one another.

It’s also curious that over half of Consultants/Freelancers reported earning less than $40k per year, with 35.3% reporting $50k or more for their annual salary. 11.8% reported $80k+! To me, this speaks to the low barrier of entry to link building. If you can communicate digitally and write well, there are many agencies that will train you on the technical side of link building.

With a low barrier to entry, there’s an abundance of entry-level link builders, but not nearly as many with years of experience. Once you learn link building, you can grow into many different avenues — technical SEO, web development, marketing, possibly even PR. The truth is, the best link builders I know have grown branches of their skills in these ways, and naturally become a T-Shaped marketer.

Which types of clients do you work with the most?

This was another “Select all that apply”-type answer. Earlier in the survey there were indicating factors that SMBs were the most popular clientele of link building, and the data supports that. SMB won far and away, but it’s fascinating to see that B2B and B2C were an exact even tie!

This spread has held true for my own experience working at an agency the past few years. I’ve always felt like we’ve serviced an even number of clients in both B2B and B2C, and a majority have been small- to mid-sized businesses. However, enterprise clients have become more frequent. Today a significant share of our revenue is from a smaller set of large enterprises, but they make up the smallest percentage of our actual client base.

With the even spread of B2B versus B2C, John thought it might be interesting to compare average monthly budgets for LB. The distribution is very similar across the two, with exactly the same number of respondents.

http://ift.tt/1RZ105j

It would appear to not be an impacting factor on spend; neither B2B or B2C is necessarily more expensive than the other. To me, this makes sense. The necessary spend for link building is dependent upon the needs of the brand, which is generally dictated by their size and competition.

As such, I also compared the average monthly spend of SMB versus Enterprise responses. Keep in mind that there were 214 responses for SMB and only 90 for Enterprise. I used a line chart to better display the trends, rather than the comparison of total responses per client type.

http://ift.tt/1N5WdaA

Although a majority of both enterprise and SMB budgets were in the “Under $1,000” to “$2,500–$5,000” categories, there is a distinct difference. Within the SMB trend, the number of responses went consistently down with each increase in budget tier. In the enterprise responses the opposite is true, as the numbers trended up with each budget tier increase.

It’s also interesting to note that after the first 3 budget tiers, SMBs responded with an even amount of higher tier budget ranges as the enterprise. This was even with over twice the number of total SMB responses compared to enterprise.

Which link building tactics do you use?

survey q10 link building tactics used.png

This was another question that was in “Choose as many as you like” format. 90% of respondents selected Content Publication/Promotion or Guest Posting as a link building tactic used. Nearly every other tactic received at least 50% of the audience votes.

Content links in the body of the page is what we’re all after. That said, many of the other tactics listed can lead to in-content links; but the creation of content is a value proposition with the strongest chance of leading to an acquired link. Building links by creating content is simply used more than any of the other tactics.

Every other typical white-hat technique listed received a near equal amount of votes. I believe this shows that most of us think a diversified link portfolio is the best path to follow. Many voted for usage of many different tactics, rather than selecting only one option and moving on. It caught my eye to see Digital PR voted so highly, considering the very small number of respondents (6) that identified as an in-house PR.

Only Paid Links and Old School received under a third of the votes — a not insignificant portion. Nearly a quarter of our audience voted for old-school tactics, which is still a higher percentage than I expected.

Which link building tactics do you feel are the most effective?

survey q11 LB tactics feeling effective.png

Again, this question was presented as a “Select all that apply” format, and received far less total selections than the previous question! “Which link building tactics do you use” had 1959 selections. This question only received 1161.

The audience of this survey appears to believe Content Publication/Promotion or Guest Posting is worth pursuing and effective, and that diversification is important… But they’re not quite sure how valuable the rest of the tactics really are.

Every other white-hat link building tactic received half of the respondents’ votes, but only a quarter of the audience feels those other tactics are the most effective. It seems that the third of the audience which responded as using Old School are also diversifying with other tactics they feel are more effective.

Once again, it’s curious to see Digital PR as the second-highest category below content links. It would seem to me that our audience of link builders are adopting the skills and strategies of their PR counterparts, rather than link building moving in-house to the PRs. It’s also possible more agencies are branding their link building as digital PR, a trend I’ve seen rising over the past couple of years.

Which SEO tools do you use in your campaigns?

survey q12 LB tools used.png

This question was also “Choose as many as you like,” with the order randomized when presented to the audience. No selection received more votes than the Google suite. I expected a high number of votes for Moz and BuzzStream thanks to Rand Fishkin and Paul May assisting with promotion of the survey, but several other tools held their own!

Tools which received at least 40% of respondents’ votes:

  • Google Analytics/Search Console (WMT)
  • Moz
  • BuzzStream
  • Ahrefs
  • SEMrush
  • BuzzSumo
  • Majestic
  • Screaming Frog

There were 60 custom entries in the follow up question for “Enter any other tools you use that weren’t listed.” If you would like to view them, they’re available in the raw data spreadsheet on this tab. Almost every answer was unique; the diversity of responses speaks to the incredible number of SEO tools available.

Only a few tools were mentioned multiple times in “Other” custom entries:

  • Citation Labs’ Link Prospector
  • Searchmetrics
  • Link Research Tools
  • Scrape Box

How integrated is your link building with other marketing processes?

survey q13 how integrated is LB.png

There was a huge spread on this question, and respondents had to choose only one number. More people selected 5–10 (64% of votes) than 0–4 (23% of votes). Over two thirds of the audience believe their link building is more integrated than not, or are at least trying to move that direction.

One of my favorite Whiteboard Fridays of all time was by Cyrus Shepard, called “The Rules of Link Building.” In it, he shares a quote that has resonated with me to this day:

“At its best, good link building is indistinguishable from good marketing. When you’re doing link building right, you don’t even need the links because you’re doing good marketing. You’re pushing your content out there, you’re talking to those influencers, you’re getting traffic to your site, and those just happen to be the signals that Google wants to reward.”

While I do believe you need the links for better search rankings, I think Cyrus is completely correct in the statement he made in April of 2014. This kind of sentiment is what has driven more collaboration between link builders and other departments in the digital marketing mix.

Only 15% indicated level 9 or 10 for integration, showing this is still a work in progress. 53% of total responses were in the 5 to 8 range, indicating this is something that we’re working towards but many feel still have distance to go.

What is the best name for link building?

survey q14 best name for lb.png

Over the years you may have noticed a few different rebrands or identifiers for what some would simply call “link building.” This was our final question and another “Select all that apply” type. Though I prefer “link building” to describe what I do, I’ve actually always liked “link earning”; however, it was the least popular selection.

Much of the link work I’ve been involved in could easily be called content marketing, but it was specifically for the purpose of links and improving search rankings. I think it’s really all a matter of perspective in most scenarios.

Final thoughts

The link building landscape has always been a swiftly shifting environment. This year’s survey results illuminated an evolution towards integration with other marketing channels, and an alignment with more legitimate future-proof thinking. However, it seems that the cost and salary scale of link building has not yet matured as much as the practice itself.

The past few years have seen link building shaken up, in a state of suspension. 2015 and 2016 so far have been the settling-down period. I see the industry calming down, relying less on tricks and schemes, while taking advantage of link building’s intrinsic presence in all the channels of the marketing mix.

Thank you for reading this year’s link building survey results. A very special thanks to everyone that took the survey and helped promote it. I’m a fallible human with my own biases, thoughts, and beliefs. I tried to objectively view the data to pull out insights, but I’d love to hear from everyone else in the comments.

Sign up for The Moz Top 10, a semimonthly mailer updating you on the top ten hottest pieces of SEO news, tips, and rad links uncovered by the Moz team. Think of it as your exclusive digest of stuff you don’t have time to hunt down but want to read!

from Moz Blog http://ift.tt/1W8rTDA


from WordPress http://ift.tt/1RZ2Enq

Monday, April 4, 2016

Have we reached peak content? Insights and issues highlighted by #ClickZChat

We’ve spoken a lot about the problem of peak content recently.

With so many more businesses now adopting publishing models to reach their audience and focus on inbound, it is becoming harder for both users and distributors to cut through the noise and uncover the really useful information out there.

Of course, it’s fairly easy for us to spout opinion on this issue, but we wanted to know first hand how this is affecting marketers, so we decided to kick off our inaugural #ClickZChat on Twitter by asking our followers about the issues and possible solutions.

We decided to start by asking: is there really an issue here? Do you believe that we’ve reached (or are heading for) peak content? The point when there is so much information available that it becomes effectively useless?

Emma_SEO weighed in on this, asking if ‘peak content was simply part of the eternal marketing search for the most relevant customer channel

With so much happening, it can be difficult for businesses to gain attention. Is the focus now too heavily focused on broadcast and moving away from genuine interaction? CatalystSEM’s SEO Director Paul Shapiro agreed that we seem to be concentrating on volume rather than value:

This search for audience may have left marketers feeling the need to ‘be everywhere’ however, often spreading themselves too thin across multiple channels. Agency Director Kate Bogda summed the issue up nicely:

While Search Engine Watch’s own Christopher Ratcliff pointed out the need for publishing organisations – whether traditional or those adopting the ‘brands as publishers’ model – need to find new ways to reduce volume and provide insight:

Wayne Schilstra Team followed up here, pointing out that it wasn’t just about creating great content, but focusing on user intent. When and why do people need this content? Relevance almost always trumps volume:

Finally, with so much happening, can content still make waves? We wanted to know which creative examples had inspired you recently.

We had a huge range of examples here, from Denny’s personalised tweets, O2 urging us all to ‘be more dog’ and movie marketing that can still make an impact a decade after it was originally conceived:

To finish on a lighter note, I’m going to big myself up at this point as I think Netflix has been doing some excellent work over the past year… and this conversation resulted in a fully-functioning House of Cards PollyHop search site.

Nice to see that social interaction can still take us in unexpected directions and provide standout creative: https://twitter.com/themick79i/status/715470399706771457

Key takeaways:

Overall it seems that marketers believe that too much content is becoming an issue.

The key here is to focus on intent and extraordinary value, rather than desperately hunting for updates to fill every social channel, creating hub content and building spin-off micro-content by channel can be a far more effective method.

By cutting down on volume, content creators also free themselves up to spend more time creating something truly useful.

Thanks to everyone who participated in #ClickZChat. We’ll be holding our next session over on Twitter at noon EST on Wednesday, April 6th when we’ll be talking about social media and Twitter in particular.

Do you believe Twitter has a future? We’d love to hear your opinions so do join us then.

from Search Engine Watch http://ift.tt/1RIzROs


from WordPress http://ift.tt/1S33Q2V

21 quick ways to find inspiration for creating content

There is an increasing need for online content, and both content writers and content marketers know the struggle of constantly seeking the next great post.

It’s not always easy to come up with a content idea that will lead to an interesting post, especially when there’s time pressure or, simply, lack of inspiration.

In order to maintain your productivity and feel inspired for your next post, it is helpful to get organised in advance and create a list of resources and tools that will help you find an idea for your next post.


I’ve compiled just such a list to help you next time you run out of inspiration…

Social media and trending topics

Social media may turn into your primary source of inspiration for your next post’s topic, especially when you know how to organise what you come across from time to time.

Facebook’s saved posts

Facebook introduced the ability to save posts, links, pages, videos back in 2014 and this has significantly changed the way we consume content, both personally and professionally.

By the time you come across an interesting article, all you have to do is save it for future reference.

What makes it special? The fact that we’re all using the most popular social network daily, which means that there are more chances to come across an interesting post (provided that you are already following the right sources that will inspire you accordingly).

fb saved

Twitter lists

This is probably one of my favourite ways to consume content and it may be very helpful when you’re trying to follow the latest trends in the industries you’re interested in. It serves both as a source of inspiration, but also as an easy way to analyse what your competitors, or other influencers, are writing about.

It might take a while until you create the right lists, but you won’t regret it once you realise how easy it is to keep up with the news.

If you’re still unsure whether this may be helpful for you, feel free to check my list on content marketing to see how the sources (and their tweets) are displayed.

twitter lists

Twitter chats 

Twitter chats offer useful insights, while they also allow you to join a discussion with other people sharing the same interests with you. Whether you follow your brand’s Twitter chats or join other popular discussions, you might be closer thank you think to your next great topic.

Twitter likes

Twitter likes, formerly known as ‘favourites‘ are an indication of your approval of other people’s posts. However, they may also be used as a way to organise interesting posts, since your Twitter account displays all your likes in one useful list.

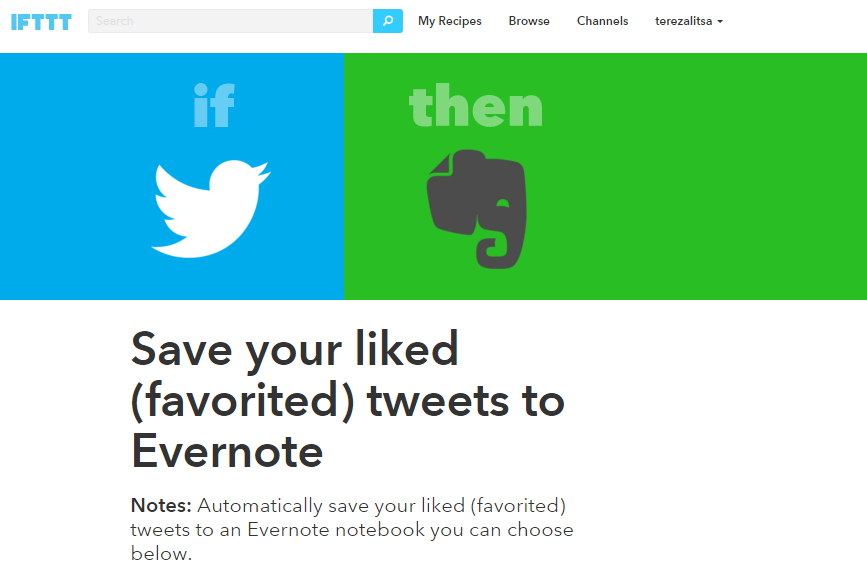
If you find this organisation useful, you might improve it with the use of IFTTT. What if you organise your likes on Twitter and save them to Pocket, Evernote, or any other tool that helps you go back to the content you liked?

twitter favourites

(More on IFTTT below)

Pinterest boards

Pinterest is all about organisation and curation and that’s what makes it useful when looking for your next topic. Whether it’s a group board on your favourite topics (full of new links and infographics) or a custom-made board from you to collect interesting articles, Pinterest may be surprisingly useful for content discovery.

pinterest

Pulse by LinkedIn

LinkedIn’s own publishing platform, Pulse, attracts many influencers posting about several different topics and of course, everyone can be part of it.

It may not be our main source of information during the day, but there’s an impressive quantity of great content, which could educate you on a topic, inspire you to write about it, or even challenge you to differentiate and approach from a different angle.

linkedin pulse 1

Trending topics

Both Facebook and Twitter display the trending topics that users discuss in real time and this has turned out very useful for writers and marketers that focus on the news industry and want to analyse what’s popular at every moment.

twt trends1

Ask a question

Quora

Yes, Quora, Yahoo Answers and the rest may help you beat the writer’s block and you can use them to ask a question on your own, or join the discussion in the popular question and answer community. After all, inspiration may be found in the least expected platforms.

quora content inspiration

News aggregators

News aggregators have been helpful for many years for content discovery and although they are not always among our top choices for daily use, they never seem to disappoint us.

Feedly, PopUrls, The Old Reader

 There are many sites and tools that help you organise your favourite sources and topics, with Feedly, PopUrls and The Old Reader being only a few of your available options. It’s up to you to try them out and find the one that works better for you.

popurls

Google Alerts

As we are not able to follow all our favourite trends during the day, Google Alerts allows us to discover interesting content, by compiling it according to the terms we’re choosing to monitor.

Following the trends

It’s useful to have an idea of what’s being talked about during the day and except for social networks, there are also many other ways to monitor the latest trends.

Google Trends

Google offers you interesting insights on the most popular topics, but it also allows you to compare up to five search terms and analyse their popularity.

Trendsmap

trendsmap

Except for Google Trends, there are also many sources to analyse the latest trends and Trendsmap helps you monitor what people talk about, depending on their location. This is another way to understand the viral topics of the day and write for any of them that are relevant to your industry.

Buzzsumo and Ruzzit

buzzsumo1

If you’re interested in monitoring the most popular posts depending on their social performance, then Buzzsumo and Ruzzit will be very useful.

Buzzsumo is a very powerful platform for content analysis and you can even use its free version to find the most shared topics in many categories, or even a few of the most popular topics from a site of your choice. You can even use its plugin for your browser and analyse the performance of your own posts on social media, in order to focus on topics that your audience is more willing to share.

Ruzzit compiles for you the most shared content on the web and it’s very useful that you can divide the content depending on its type, videos, images, or articles.

Bookmarking sites

Reddit, Digg and the rest

reddit

Reddit won’t disappoint you with content discovery, provided that you’re willing to search for all the right sub-categories until you feel inspired enough to write about what you came across. Be careful, it’s addictive and there are many chances you end up on completely different sub-categories from the ones you expected. There’s more information on how to do this here: How to use Reddit for content ideas.

Digg is “what the Internet is talking about right now”, while you can also use StumbleUpon and Delicious for similar purposes, depending on what works better for you.

Visual search

If you’re looking for visual content to inspire you for your next post, then here are two sources you might need to consider.

Imgur

imgur

Imgur showcases the most popular images on the web, which may be useful when looking for the next meme that fits your content marketing strategy.

Giphy

As GIFs get more popular day by day (and we can’t stop using them), Giphy is the right resource to find the perfect GIF to support your article, or your social posting. It’s also useful to monitor the most popular GIFs from time to time, as a way to be aware of what’s trending in the particular type of content.

GIPHY homepage

Analyse your content

Inspiration may be closer than you think, that’s why you need to have a closer look at the performance of your posts to measure popularity. This will help you decide what your audience likes most from you, leading you to the right direction for your next topics.

Google Analytics

google analytics

Using Google Analytics even at beginner level allows you to learn more about your content, your audience and your niche industry and this is extremely useful when writing another great post.

Have a look at your most popular articles, the search terms, the average time spent on each post and decide how the data will help you find the inspiration you’ve been seeking.

Repurpose your content

When you feel like you’re running out of topics, go back to your existing content and think of new ways to use it. After examining the performance of your posts in Google Analytics, pick the most popular articles and see whether they can be expanded into new posts, serving as a follow-up to the existing content.

What’s more, how about using your existing content to create new articles in different forms?

For example, a list article with 10 ways to improve your content marketing could become a very appealing infographic that could be shared in new platforms, also linking back to your existing content. Furthermore, you could create a video, or a podcast from an old post and then discuss the topic, adding new ideas to it. This still counts as newly found content inspiration.

How to make content discovery easier

Write down your content ideas

Get ahead of your writer’s block and keep track of all your ideas right when you feel inspired. Even the simplest note-taking may be useful. Find the platform, or the app that works better for you, with Google Drive, Dropbox, Evernote, Trello, Notes being only a few of your choices.

giphy (1)

Save posts to read them later

Yes, that’s what we were discussing about Facebook and saved articles, but there are also many other platforms that help you go back to the content you previously discovered and read it at your own pace (or use it as a resource for your post).

Pocket, Instapaper, Flipboard and many other apps facilitate this very useful habit and the easy mobile reading makes them even better.

Automate content organisation

If you still feel that you’re not organising the content you’re reading, then IFTTT will help you automate the process, by mixing your favourite sources into powerful recipes.

Here are some examples of the combinations you could use to facilitate the content discovery:

Listen to your audience

Your readers, but also your social followers may be the right source of inspiration for your next post, with questions, comments, or even complaints helping you understand their preferences, in order to provide them better content on your future posts.
giphy

Finally, this is the process that usually works for me when looking for content inspiration (and I’d love to hear about yours):

  • Extensive reading and browsing (mostly through Twitter lists and Buzzsumo)
  • Saving the most interesting topics to Pocket
  • Writing down titles inspired by the posts I read on my content spreadsheet on Google Drive
  • Going back to the content spreadsheet to decide upon the titles that make the best posts
  • Search for the relevant resources that initially inspired me on Pocket to re-read the articles
  • Close all tabs and start writing

from Search Engine Watch http://ift.tt/1ZZC9hK


from WordPress http://ift.tt/1XbPTUF

How does Google determine my local ranking?

Google has just updated how it determines your business’s local ranking.

Another week, another step towards Google becoming a damn sight more transparent than we’re used to. If it wasn’t enough that Google revealed its top three ranking signals for organic search last Friday, this Friday it revealed a new ranking signal for local search… Prominence.

As noticed by Mike Blumenthal, and reported by SEJ over the weekend, Google has updated its Google My Business help page.

This resource details how you can improve your local rankings with practical guidance on keeping your business information complete and accurate (physical address, phone number, category), verifying your location(s), keeping your opening hours accurate and managing customer reviews.

It also lists the ways in which Google determines your local ranking…

How Google ranks your business for local search

Relevance

How well does your local listing match what someone is searching for? This is why you business information should always be fully detailed and accurate.

Distance

How close are you to the person searching for a particular term? Bear in mind that relevance will be the stronger signal. If a business is further away from a searcher’s location, but is more likely to have what they’re looking for than a business that’s closer, Google will rank it higher in local results.

Additionally, if a user doesn’t specify a location, Google will calculate distance based on what’s known about their location.

And this weekend Google added another…

Prominence

Basically… How well known is your business?

Here’s the exact wording on ‘prominence’ from Google…

Some places are more prominent in the offline world, and search results try to reflect this in local ranking. For example, famous museums, landmark hotels, or well-known store brands that are familiar to many people are also likely to be prominent in local search results.

Prominence is also based on information that Google has about a business from across the web (like links, articles, and directories). Google review count and score are factored into local search ranking: more reviews and positive ratings will probably improve a business’s local ranking.

Your position in web results is also a factor, so SEO best practices also apply to local search optimization.

Your business’s overall organic search presence is a ranking factor when it comes to local.

So ultimately, all of your regular, everyday SEO practices that you do to boost your rankings, whether on-page or off, apply to local.

Customer reviews

It’s also interesting to note that has Google confirmed that customer reviews and ratings are factored into local search ranking. (Although be warned that there was a ‘probably’ in the original text above.)

Experts always figured this was true anyway. Moz previosly found that review signals are 8.4% of the overall ‘local ranking pie’.

moz-local-ranking1

But again, it’s just nice to get confirmation on these things.

Tl;dr

Accurate and complete Google My Business information + accurate location data + positive customer reviews + traditional SEO tactics = good local ranking (possibly).

from Search Engine Watch http://ift.tt/1RzxWPF


from WordPress http://ift.tt/1RzzxVA